Water Fleet Control

Managing a fleet of connected water purifiers

WEB
Water Fleet Control
Role: Product Designer, the only designer on the productPlatform: B2B web platform for connected devicesScope: Research, product structure, UX/UI, design system, notifications

A management system for a fleet of connected water purifiers, about 15,000 devices in offices, schools, and clinics across Europe. Each device reports its state, and the platform is where the manufacturer, service partners, and support see and act on it.

I was the only product designer. Together with the product manager, I interviewed stakeholders and the people who operated the fleet every day, then designed the product structure, the workflows, the design system, and notifications. The system went into production and was used as a working tool.
Operating model

One record from the factory to the service visit

A device is not a row in a table. It moves through stock, assignment, installation, and years of service, and every stage produces data the next one depends on.

  1. 01

    Produce

    Model, batch, quality check

  2. 02

    Stock

    Warehouse, scanning, availability

  3. 03

    Assign

    Customer, service partner, plan

  4. 04

    Monitor

    Connection, telemetry, errors

  5. 05

    Maintain

    Filters, hygiene, remote settings

  6. 06

    Service

    Tasks, visits, confirmation

01 · Start from the whole fleet

Fifteen thousand devices, seen as a map

At this scale, a list of individual problems on the home screen is noise: there is always something offline somewhere. The people running the fleet first need the big picture: how many devices there are, where they are concentrated, how many are online or in service, and which regions and partners carry the load.

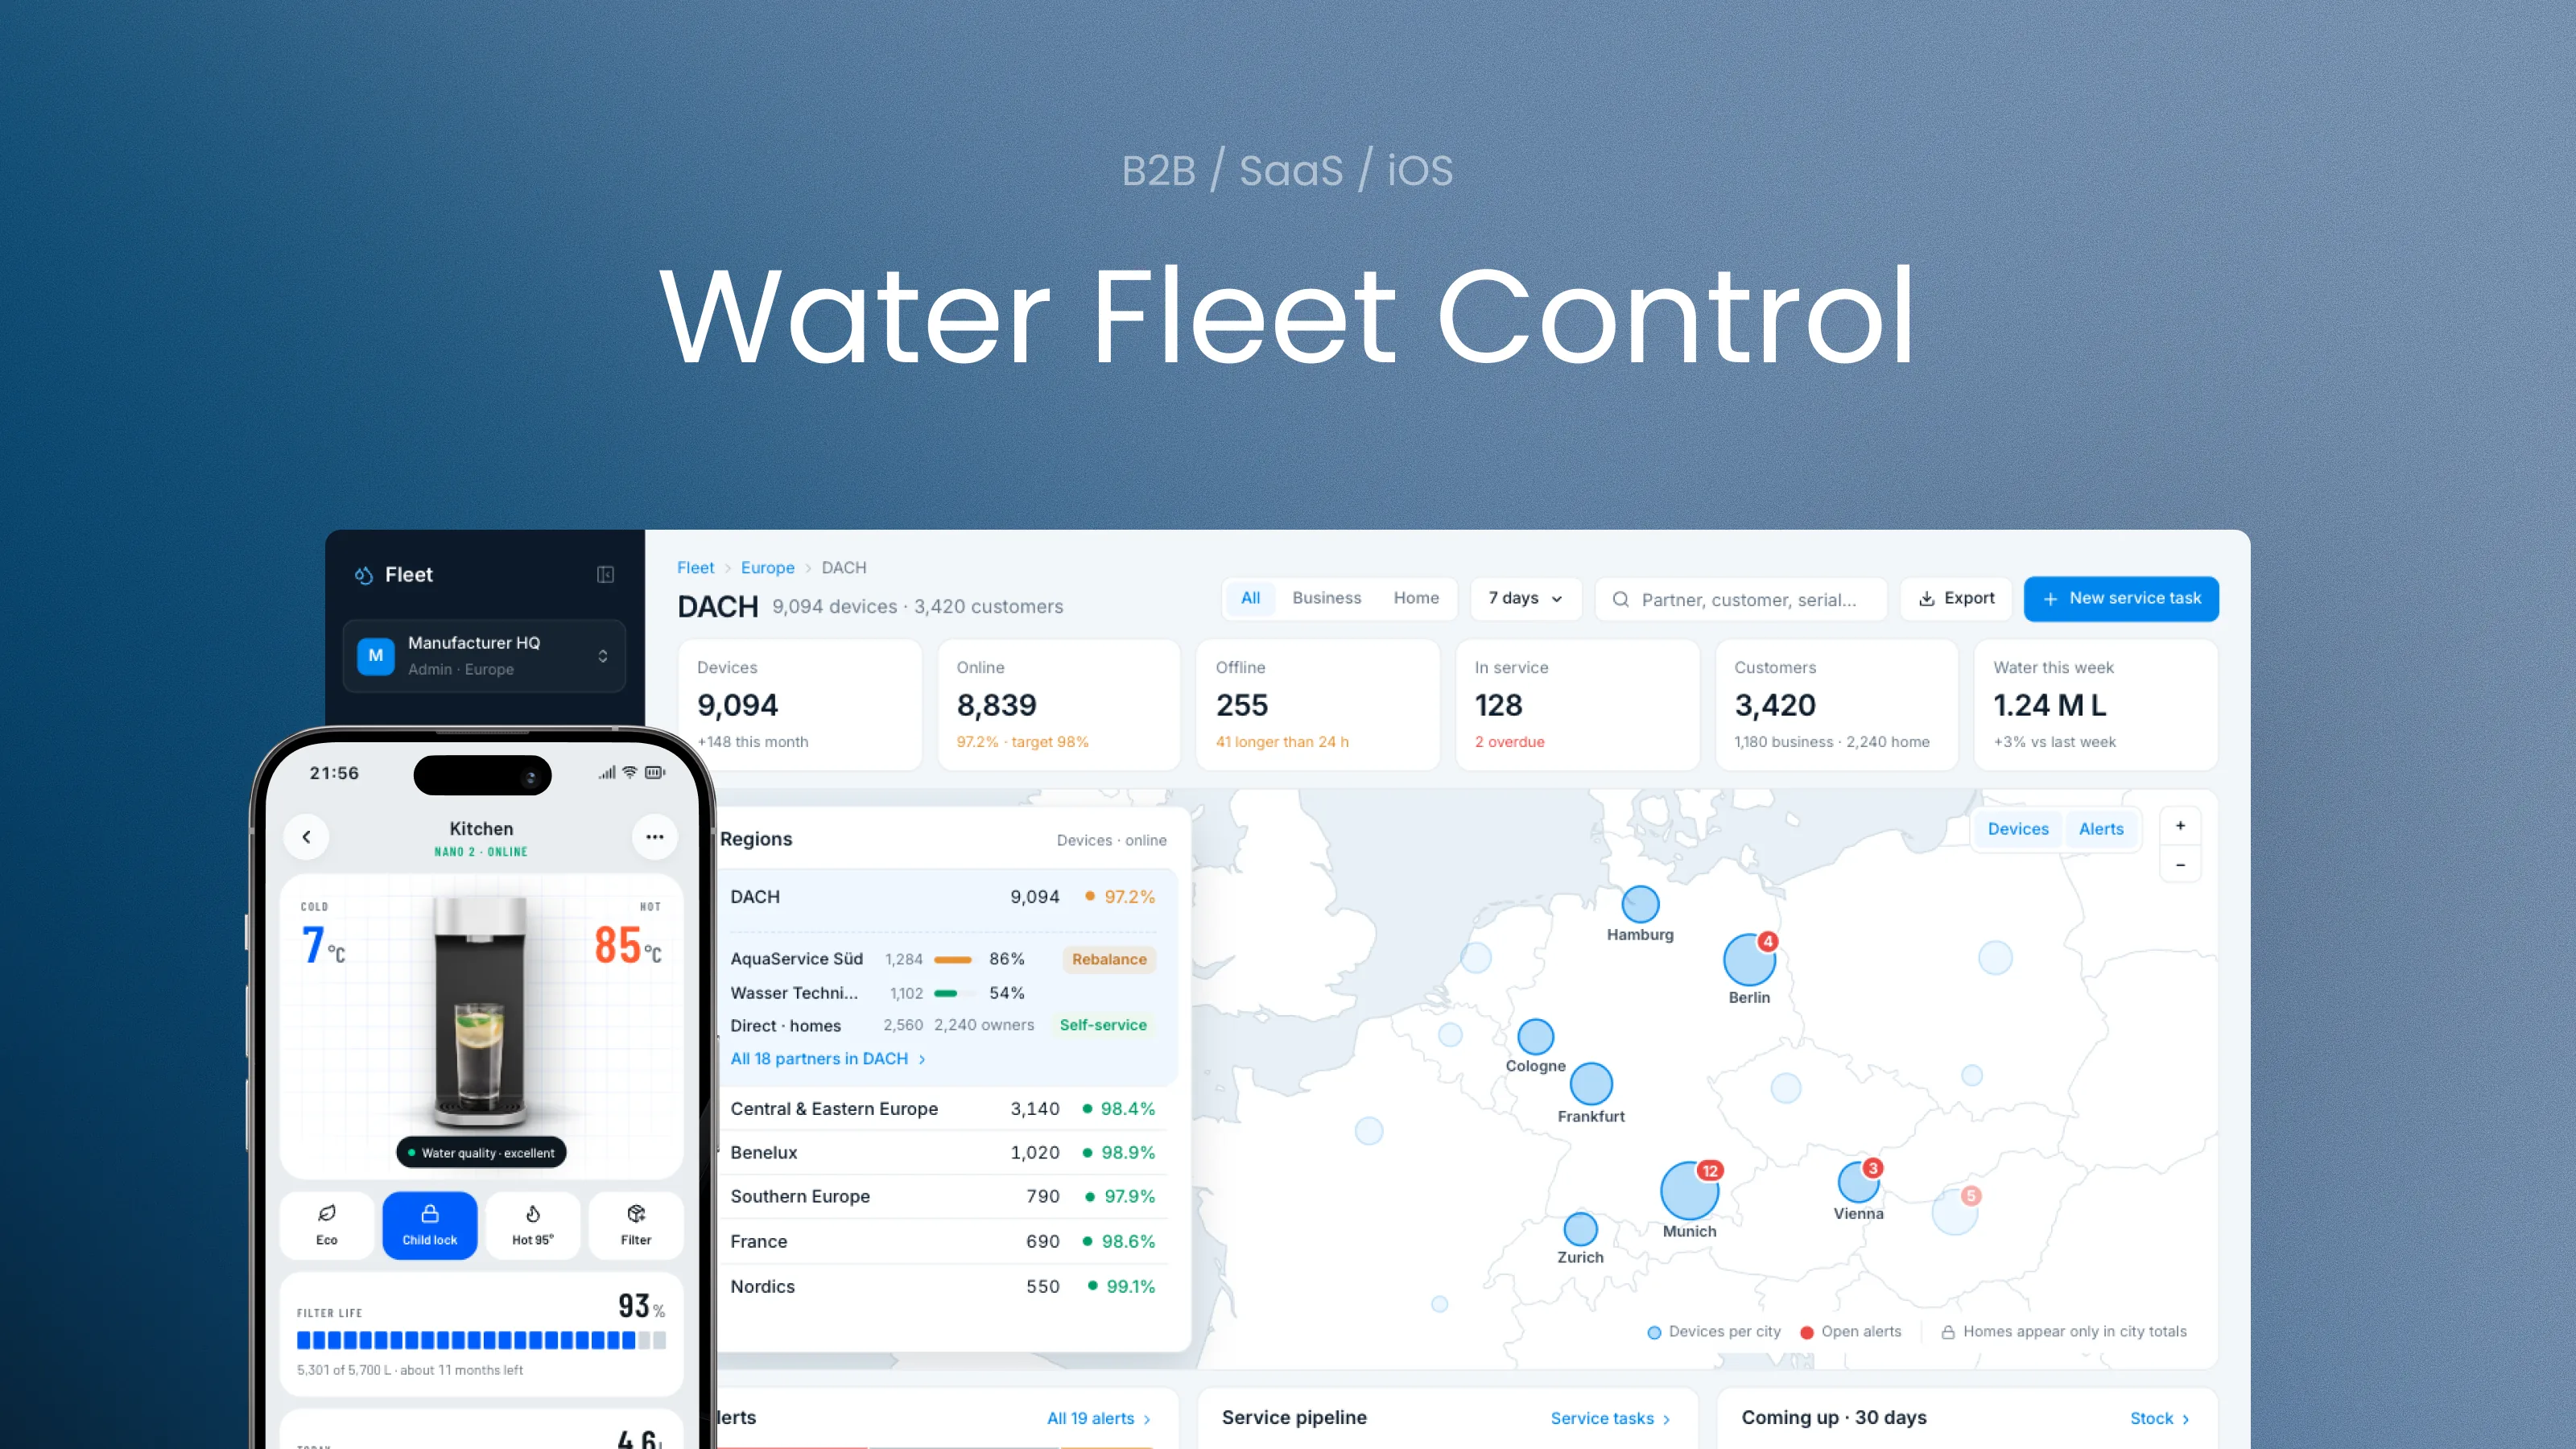
So the overview starts from a real map. Device concentrations by area, open alerts on top of them, and a list of regions next to it. Selecting a region opens its partners right in place, which is the first step of the path from global to particular.

Fleet overview: global KPIs, a map of device concentration across Europe with open alerts, and regions with their partners

From global to particular

Region → partner → devices → one device. Each level answers its own question.

The map as the entry point

Where devices are concentrated matters more than any single row.

Individual issues go to tasks

Single problems reach people through notifications and service tasks, not the fleet overview.

02 · Region and partner

Manage the fleet through the people who serve it

Devices in a region are maintained by independent service partners, so the partner is the natural middle level of the hierarchy. For each partner the operator sees how many devices and customer sites they serve, how healthy that part of the fleet is, and how loaded the partner is this week.

This is where decisions are made: whether a partner can take more devices, whether visits need to move, or whether a region needs another partner. From here, one click opens exactly this partner's devices.

Partners in DACH: the list of partners, and a selected partner with KPIs, customer sites, and weekly capacity
03 · Devices

Detailed filters for thousands of devices

The device list is where the fleet is actually managed, so filtering has to be precise. Connection, state, filter life, model, site type, and firmware are always visible with live counts, so the operator sees the shape of the selection before opening it. The scope from the previous level, like the partner, stays as a removable chip.

I combined grouped search by device ID and MAC address with filters, live counts, and configurable columns. I also added a plain-language query that turned into the same visible filters, so operators could always see how the result was built. After selecting devices, they could change settings, create a service task, or plan a route in bulk.

Devices of one partner: detailed filters with counts, a plain-language query turned into filters, and bulk actions for 7 selected devices
04 · Device passport

Open a device without losing the list

The device opens in a side panel over the list, so an operator can go through several devices in a row. Tabs follow the questions people actually ask: is it maintained, how is it used, how is it set up, what is happening right now, and what happened before.

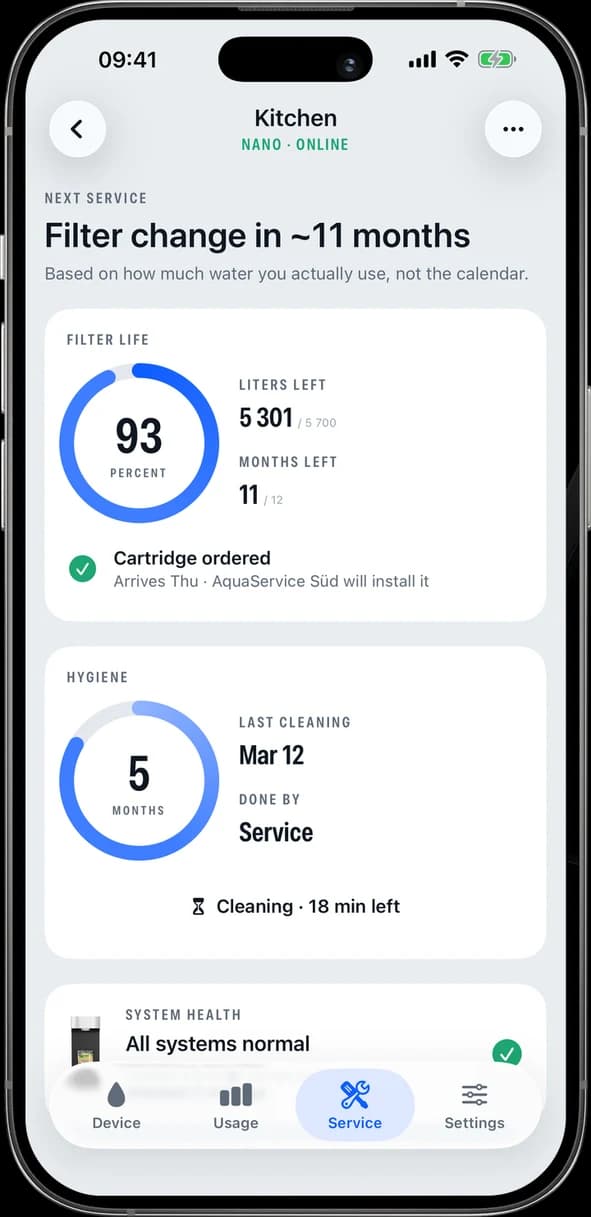
Filter changes used to follow the calendar. But a device in a busy office and one in a quiet school use very different volumes. Forecasting by the litres that actually passed through the filter makes maintenance earlier where it matters and saves visits where it doesn't. The same telemetry reveals slow problems, like hot water cooling down over two weeks, before they become a breakdown.

Device passport: usage-based filter forecast, hygiene status, and a detected slow decline in hot water temperature
05 · Remote settings

Make remote changes safe

Cooling, energy-saving schedules, and portion presets can be changed remotely, for one device or a whole group. A mistake here affects real kitchens, so the flow is built around confidence. Breadcrumbs and steps show where the operator came from and what is left; the selection stays visible and editable; the review shows exactly what changes, what happens to offline devices, and how to roll back.

Every change, whether made by an operator, a service partner, or the user in the mobile app, is written to the device history as “was → became”, with the author and time. When something behaves strangely, the first question is always “what changed?”, and the answer is one tab away.

Changing settings for 42 devices: breadcrumbs and steps, the current selection, highlighted changes, delivery to offline devices, and a way back
06 · Stock and assignment

Follow the device through its life

Stock, models, and assignment were separate sections, but for the team they were one process. The device is scanned in the warehouse, assigned to a customer with a service partner and maintenance plan, installed, and only then becomes part of the active fleet.

Seeing the whole pipeline exposes the gaps between stages: devices that were assigned but never came online, stock that isn't moving, returns waiting for a decision. These are exactly the places where the operational process loses devices.

Device lifecycle: counts per stage, assigning a scanned device with a suggested partner, and the journey of one device
Free demo

Click through the admin

The same screens, connected: switch regions on the map panel, open a partner, filter devices, open a device passport or a bulk settings change. Data is a demo snapshot; nothing is sent anywhere.

FleetEuropeDACH

DACH 9,094 devices · 3,420 customers

AllBusinessHome7 daysPartner, customer, serial…ExportNew service task
Devices9,094+148 this monthOnline8,83997.2% · target 98%Offline25541 longer than 24 hIn service1282 overdueCustomers3,4201,180 business · 2,240 homeWater this week1.24 M L+3% vs last week
Munich12Berlin4FrankfurtVienna3HamburgCologneZurich51213

Regions

Devices · online
DACH9,09497.2%
AquaService Süd1,28486%RebalanceWasser Technik Berlin1,10254%Donau Filter96861%Direct · homes2,5602,240 ownersSelf-serviceAll 18 partners in DACH
Central & Eastern Europe3,14098.4%
Benelux1,02098.9%
Southern Europe79097.9%
France69098.6%
Nordics55099.1%
DevicesAlerts
Devices per cityOpen alertsHomes appear only in city totals
+−

Alerts

All 19 alerts
Faults7Offline8Filters4
Opened 77Resolved 755 older than 24 h
MonTueWedThuFriSatSun

Handled by partners 13 · by owners in the app 6

Service pipeline

Service tasks
New12
Assigned18
Technician en route5
Done this week64
Overdue2 · AquaService SüdMedian response6 h 40 min SLA 8 h

Coming up · 30 days

Stock
Filter replacements340due
In stock · DACH280filters
Short by 60
Create order for 60 filters
Hygiene service42 this weekHome subscriptions1,120 ship automatically
Free demo · regions, partners, devices and a device passport
07 · Service network and notifications

Close the loop with the people on site

Maintenance was handled by independent service partners. I designed bulk reassignment of devices and connected the full service loop: a forecast became a task, the task went to a partner, the partner confirmed the visit, and the device data confirmed the result.

I also designed the notification system. The key decision was to notify roles about decisions they own, not about every event.

Operator

Device offline for more than 24 hours, repeated errors, overdue tasks.

Service partner

New task, route for the week, a device that needs a check during the visit.

Customer

Filter change soon, visit scheduled, settings changed by service.

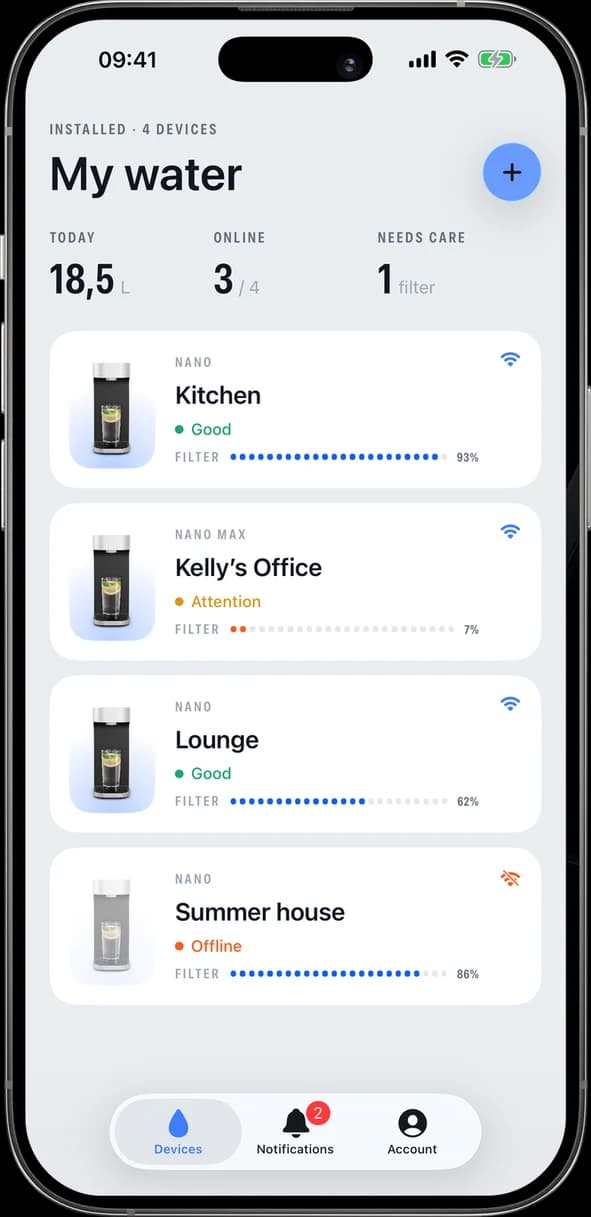
08 · Customer app · concept

Give owners control over their own devices

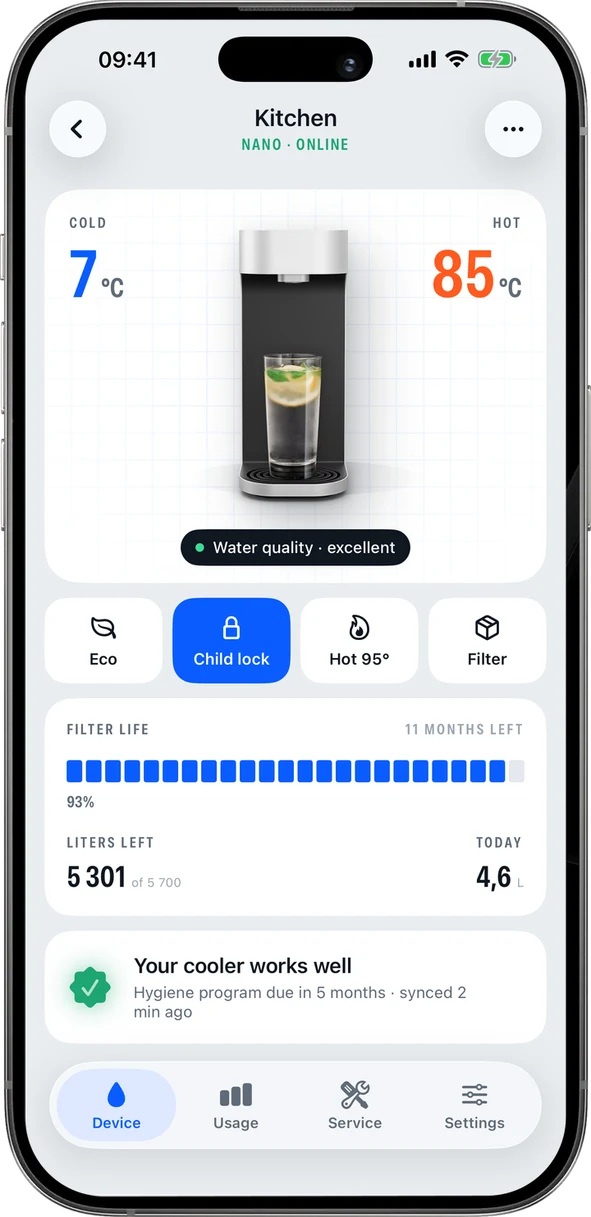
The same system extends to the people who use the water every day. The customer app shows the state of their own devices and lets them act without calling support: see when the filter needs changing, order a replacement or book a visit, and adjust settings within the limits set by the manufacturer.

It uses the same data model as the admin platform, so every change made in the app appears in the device history, and every visit planned by a partner is visible to the customer.

Devices
Devices
Dashboard
Dashboard
Statistics
Statistics
Maintenance
Maintenance
Settings
Settings
Scenario · Usage

See how water is used

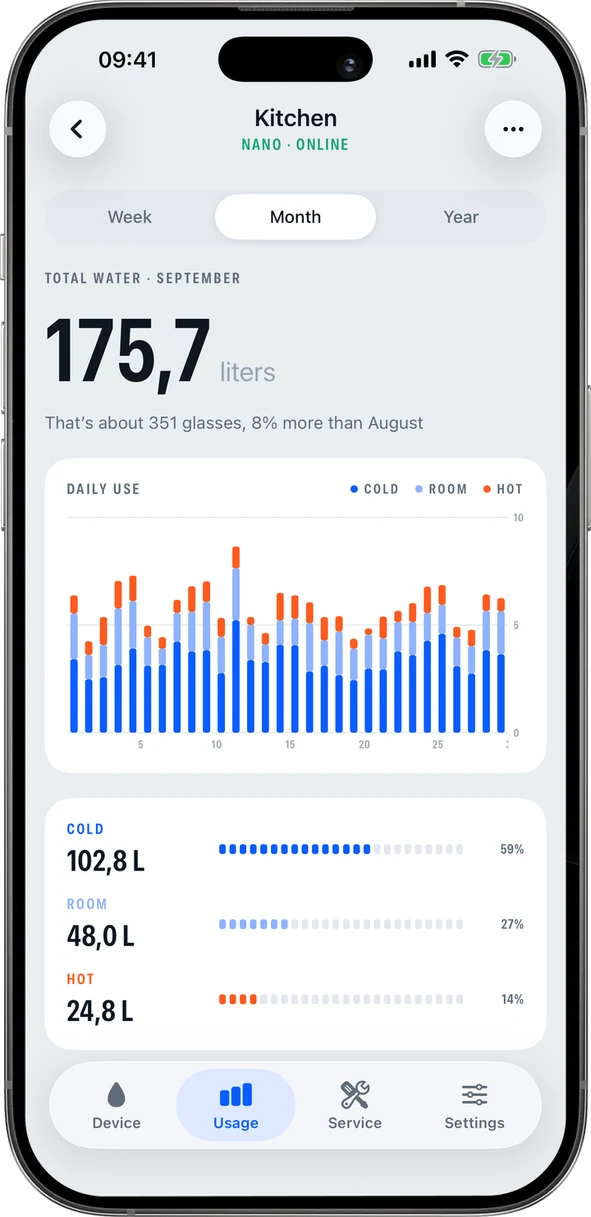
Owners rarely think about how much water they drink until the filter runs out. Statistics turn consumption into something tangible: a month or a week at a glance, split into cold, room and hot water.

The same numbers drive the usage-based filter forecast, so the app can explain why a filter change comes earlier in a busy office than in a quiet home.

Scenario · Settings

Adjust within safe limits

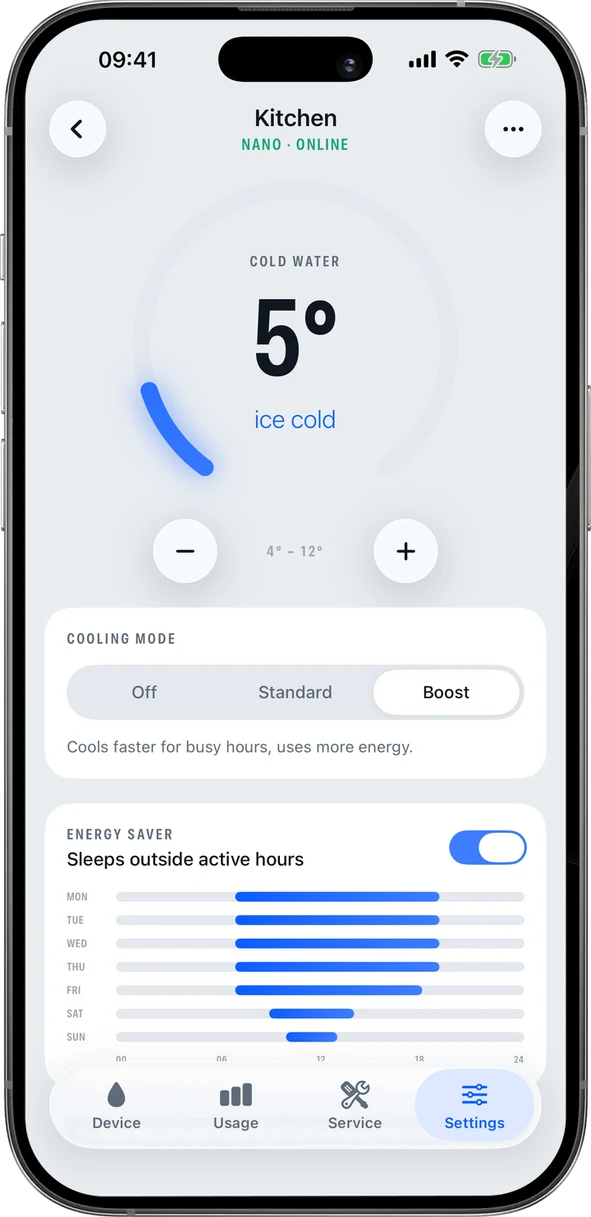
Temperature, cooling mode and energy saver can be changed from the phone, but only within the range the manufacturer allows. A large dial makes the current value readable at a glance, and every step is immediate.

Changes sync to the device in seconds and appear in its history, so the operator and the service partner see exactly what the owner changed.

Design system

A shared operating language for devices and service

Water Fleet follows a purifier from production and assignment through years of telemetry, maintenance and partner visits. The visual system makes device health, upcoming service and responsibility readable across the web platform and customer app.

A quiet blue-grey foundation keeps dense fleet data stable. Blue marks action and navigation; green, amber and red are reserved for health and service urgency. Every state also has a label or icon, so colour is never the only signal.

The customer app shares the tokens for status and action but speaks in a more engineered voice of its own: a light paper ground, a drawing grid behind the device, condensed figures and segmented meters, so owners never mistake it for the admin.

Fleet surfacesA cool light workspace with white cards; one navy level is kept for the global navigation.
  • navy.950#0e1a2aGlobal navigation
  • navy.900#0f1c2cPrimary ink
  • slate.100#f3f6f9Workspace background
  • slate.050#ffffffCards, tables
  • slate.300#e6ebf1Borders, dividers
  • slate.600#6b7a8cSecondary text
Semantic tokensScreens use roles, not hex values.

Background & surface

  • color.background.appslate.100
  • color.surface.primaryslate.050
  • color.navigationnavy.950
  • color.surface.selectedblue.050

Text & border

  • color.text.primarynavy.900
  • color.text.secondaryslate.600
  • color.border.defaultslate.300

Action & status

  • color.action.primaryblue.500
  • color.status.healthygreen.500
  • color.status.serviceamber.500
  • color.status.criticalred.500
  • color.status.offlineslate.500
Device and service scalesConnection, device health and service urgency remain separate dimensions throughout the product.

Device health

  • Healthy#1f9d63
  • Needs service#e0921c
  • Critical#e2483d
  • Offline / idle#9aa6b4

Connectivity

  • Online
  • Delayed
  • Offline

Service timing

  • Planned
  • Due soon
  • Overdue

How we measured product value

The value of this system is not in how many screens people open. It is in how quickly a problem on a device turns into a confirmed fix, and how often a visit happens before the customer notices anything.

  1. 01Signal detected
  2. 02Task created
  3. 03Partner assigned
  4. 04Visit confirmed
  5. 05Device healthy again

What the case demonstrates

This project shows how I designed for operations at scale. I structured a large system from the whole fleet down to one device, gave each level of the hierarchy a clear purpose, kept context visible, and made risky actions transparent and reversible.

It also shows how a working system can grow without being rebuilt. The same data model supports the map, partner management, usage-based forecasts, and the customer app that extends the system to the people who drink the water.