Bio Controler

Greenhouse operations and hive automation

WEB
Bio Controler
Role: Product DesignerPlatform: B2B web platformScope: Product structure, UX/UI, workflows, development supervision

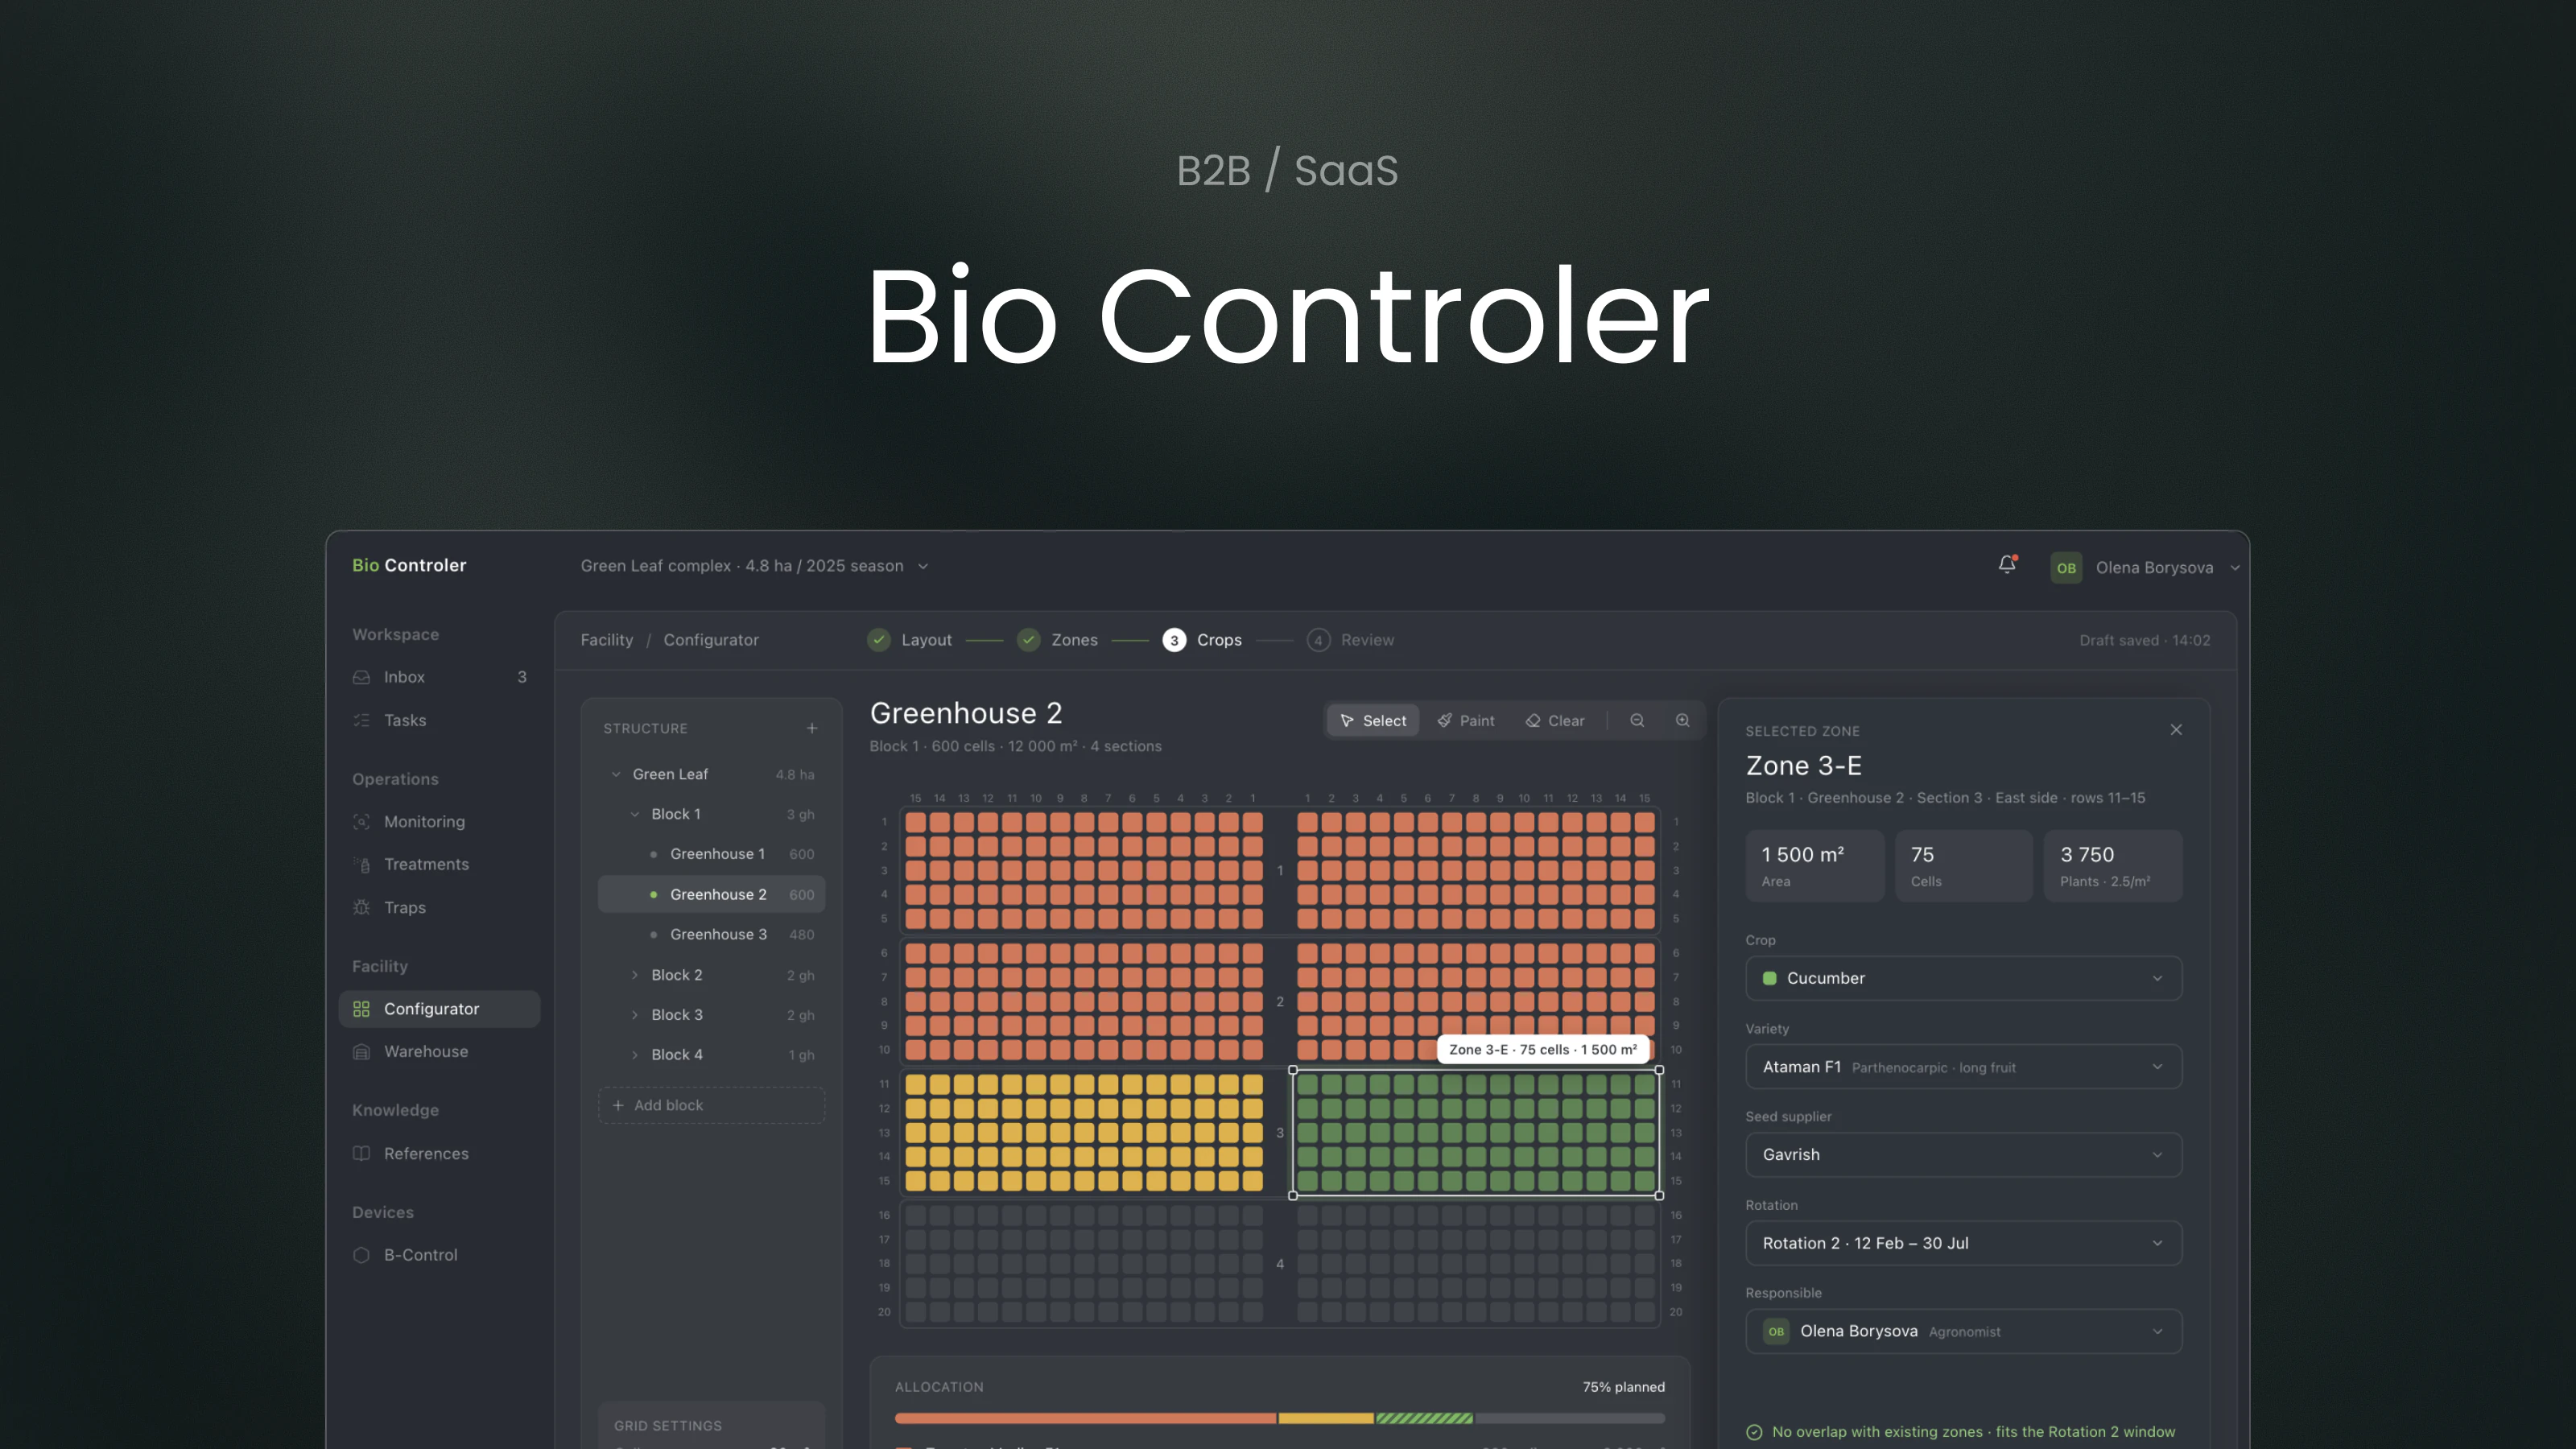
Bio Controler is an operating system for greenhouse complexes. It brought the spatial model of a facility, crop placement, recurring inspections, pest and beneficial-organism monitoring, treatment records, and reference data into one working context.

I designed the interfaces and end-to-end workflows, aligned product logic with the domain, and supervised implementation with the development team. A separate track was B-Control: an interface for managing connected hives and analysing bumblebee activity within the same product ecosystem.
Operating model

From a greenhouse map to a verified intervention

The system preserves the connection between place, crop, observation, and action. A finding during an inspection becomes part of a specific zone's history, and the effect of an intervention can be evaluated during the next monitoring cycle.

  1. 01

    Configure

    Complexes, blocks, greenhouses, and cells

  2. 02

    Assign

    Crops, varieties, rotations, and owners

  3. 03

    Inspect

    Recurring scouting on a stable spatial model

  4. 04

    Identify

    Pests, beneficial organisms, and spread

  5. 05

    Intervene

    Biological and chemical actions with parameters

  6. 06

    Verify

    Period comparison and treatment outcomes

01 · Build the spatial model

Turn a physical facility into a working map

A greenhouse complex has several levels: blocks, greenhouses, sections, rows, and cells. The interface has to do more than visualise this structure. It becomes the foundation for crop assignments, rotation planning, and every future observation.

A staged setup keeps a dense configuration manageable. Users define the geometry first, group cells into operational zones, and then assign a crop, variety, supplier, and responsible employee.

Greenhouse configurator: assigning a crop, variety, and owner to a selected zone

Scalable hierarchy

The same model supports a single greenhouse and a facility with many blocks.

Space as navigation

Teams use the same map for setup, inspection, and analysis.

Context stays visible

Properties open beside the selected zone without hiding its position.

02 · See change over time

Make inspections comparable

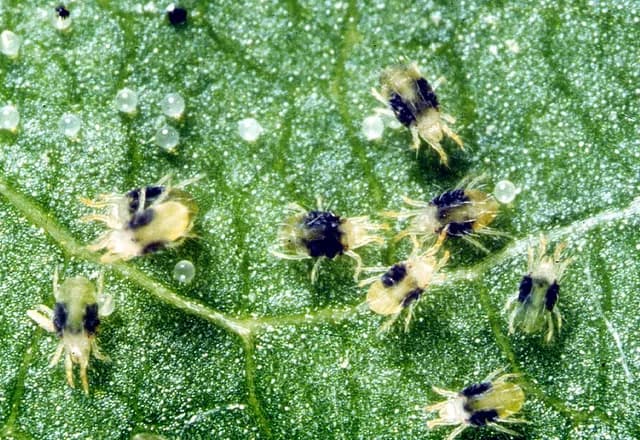
Biological monitoring is a recurring process rather than a single report. Teams inspect the same zones on a schedule, record pests and beneficial organisms, and observe how an outbreak changes from week to week.

A stable map provides the shared coordinate system; the time dimension reveals movement. Users can move from a period overview to a specific zone and see not just the current state, but the trajectory of the problem.

Monitoring: spider mite density per cell and the outbreak's spread from week 9 to week 11
03 · Move from signal to action

Connect cause, intervention, and ownership

When monitoring reveals a problem, the next action should remain connected to its place and cause. An intervention record combines date, operator, chemical or biological agent, concentration, water volume, application method, and selected zones.

This structure lets a team reconstruct the decision: what was found, where treatment happened, which parameters were used, and what should be checked during the next inspection. The intervention becomes part of the operational history instead of an isolated form submission.

Intervention: target zone from monitoring, product parameters, zone history, and a scheduled follow-up inspection
04 · Give the team a shared language

Make reference data part of the decision

Catalogues of pests, beneficial organisms, crops, varieties, treatments, and manufacturers support the core workflows. They are not a detached encyclopaedia, but a structured source of data for inspections and interventions.

A record can combine identification cues, attention thresholds, application guidance, and related control methods. This reduces the gap between recognising a problem and choosing the next action while keeping terminology and parameters consistent across the team.

Reference data: pest catalogue and a spider mite record with attention thresholds and compatible control methods
05 · Connect the physical object

Manage pollination as a measurable operation

B-Control extended the platform from manually recorded observations to connected devices. Teams could organise hives into groups, assign automatic opening and closing schedules, issue manual commands, and monitor device state.

Activity analytics helped expose an unusual drop in flights, while battery and schedule statuses made hardware health visible to the operator. My task was to bring commands, schedules, telemetry, and exceptions into one coherent workflow.

B-Control on Agrolabs ↗
B-Control: bumblebee activity, hive group opening schedule, exceptions, and device health

Designing an operating system, not a collection of forms

Bio Controler's complexity sits at the intersection of space, time, biological data, and physical devices. Four principles keep the system manageable.

01

Place before record

Every observation and action belongs to a specific physical location.

02

Change before snapshot

A value becomes useful when it can be compared with a previous period.

03

Action next to signal

An affected zone can lead directly into an intervention without rebuilding context.

04

Exceptions before routine

Operator attention goes to outbreaks, schedule failures, and unusual activity.

Design system

One language for space, biology and intervention

Bio Controler joins a spatial greenhouse model, biological observations, treatment plans, reference knowledge and connected hives. The system keeps these different kinds of information legible without turning every signal into an alert.

Dark neutral surfaces hold the operational density. Crop colours describe allocation, operation colours describe an intervention, and status colours describe urgency, so the same hue never answers two different questions.

Operational surfacesFive cool-grey levels separate the app, workspace, cards, drawers and selected objects without heavy shadows.
  • slate.950#252a31App background
  • slate.900#2c3139Workspace
  • slate.850#30363fInset panel
  • slate.800#353b44Card, side panel
  • slate.750#3f4650Drawer, popover
  • slate.700#444b55Selected, unassigned

White opacities

  • white.100
  • white.72
  • white.50
  • white.35
  • white.10
  • white.06

Text, dividers and controls use fixed white alphas across every dark surface.

Semantic tokensScreens use roles, not hex values.

Background & surface

  • color.background.appslate.950
  • color.surface.workspaceslate.900
  • color.surface.primaryslate.800
  • color.surface.elevatedslate.750
  • color.surface.selectedslate.700

Text & border

  • color.text.primarywhite.100
  • color.text.secondarywhite.72
  • color.text.mutedwhite.50
  • color.border.defaultwhite.10
  • color.border.subtlewhite.06

Action & status

  • color.action.primarygreen.400
  • color.status.successgreen.300
  • color.status.warningamber.400
  • color.status.criticalred.400
  • color.status.infoblue.400

Focus & selection

  • color.focus.ringgreen.400
  • color.selection.softgreen.16
  • color.info.softblue.08
Domain colour scalesCrop allocation, intervention type and urgency are independent scales. Their colours are never interchangeable.

Crop allocation

  • Tomato#ef8064
  • Sweet pepper#f0c060
  • Cucumber#8fca62
  • Unassigned#444b55

Observation & intervention

  • Biological
  • Chemical
  • Pest observation
  • Inspection

Operational status

  • Normal
  • Attention
  • Critical
  • Information

How product value should be measured

For this product, page views matter less than the completeness and speed of the operating loop: whether the facility is configured, inspections happen on schedule, detected risk becomes a recorded action, and the outcome is reviewed.

For B-Control, the model also includes schedule reliability, device availability, and response time to abnormal activity. Specific values should only be presented after analytics have been verified against real product data.

  1. 01Facility configured
  2. 02Inspection completed
  3. 03Risk detected
  4. 04Intervention recorded
  5. 05Outcome verified

What the case demonstrates

Bio Controler demonstrates product design for a large B2B system in which a spatial model, biological observations, operational actions, reference data, and connected devices need to function as one whole.

The core design challenge was not refreshing individual screens. It was creating understandable workflows for a complex domain and carrying those decisions through implementation with the development team.