Agro Controler

Agribusiness planning and management

WEB
Agro Controler
Role: Senior Product DesignerPlatform: B2B web applicationScope: UX, UI, product structure, design system

Agro Controler is a comprehensive product for agricultural companies that connects seasonal planning with actual work in the field. A team can build a crop rotation, model crop economics, assess equipment performance, expose capacity shortages, and turn the plan into specific work orders.

I worked not on one isolated feature, but on a system of interdependent workflows: information architecture, dense tables and calculations, visual hierarchy, and the transition from an analytical decision to an operational action.

Operating model

One season, one connected system of decisions

Every stage changes the next. Area and crop selection shape economics; operations create demand; equipment availability tests whether the plan is realistic; and an approved decision becomes work in the field.

  1. 01

    Rotation

    Crops, areas, and seasonal scenarios

  2. 02

    Economics

    Yield, revenue, and margin

  3. 03

    Equipment

    Capacity, fuel, and cost

  4. 04

    Plan

    Operations and time windows

  5. 05

    Constraints

    Resource shortages and work at risk

  6. 06

    Execution

    Tasks, work orders, and owners

01 · Shape the season

Connect an agronomic choice to its economics

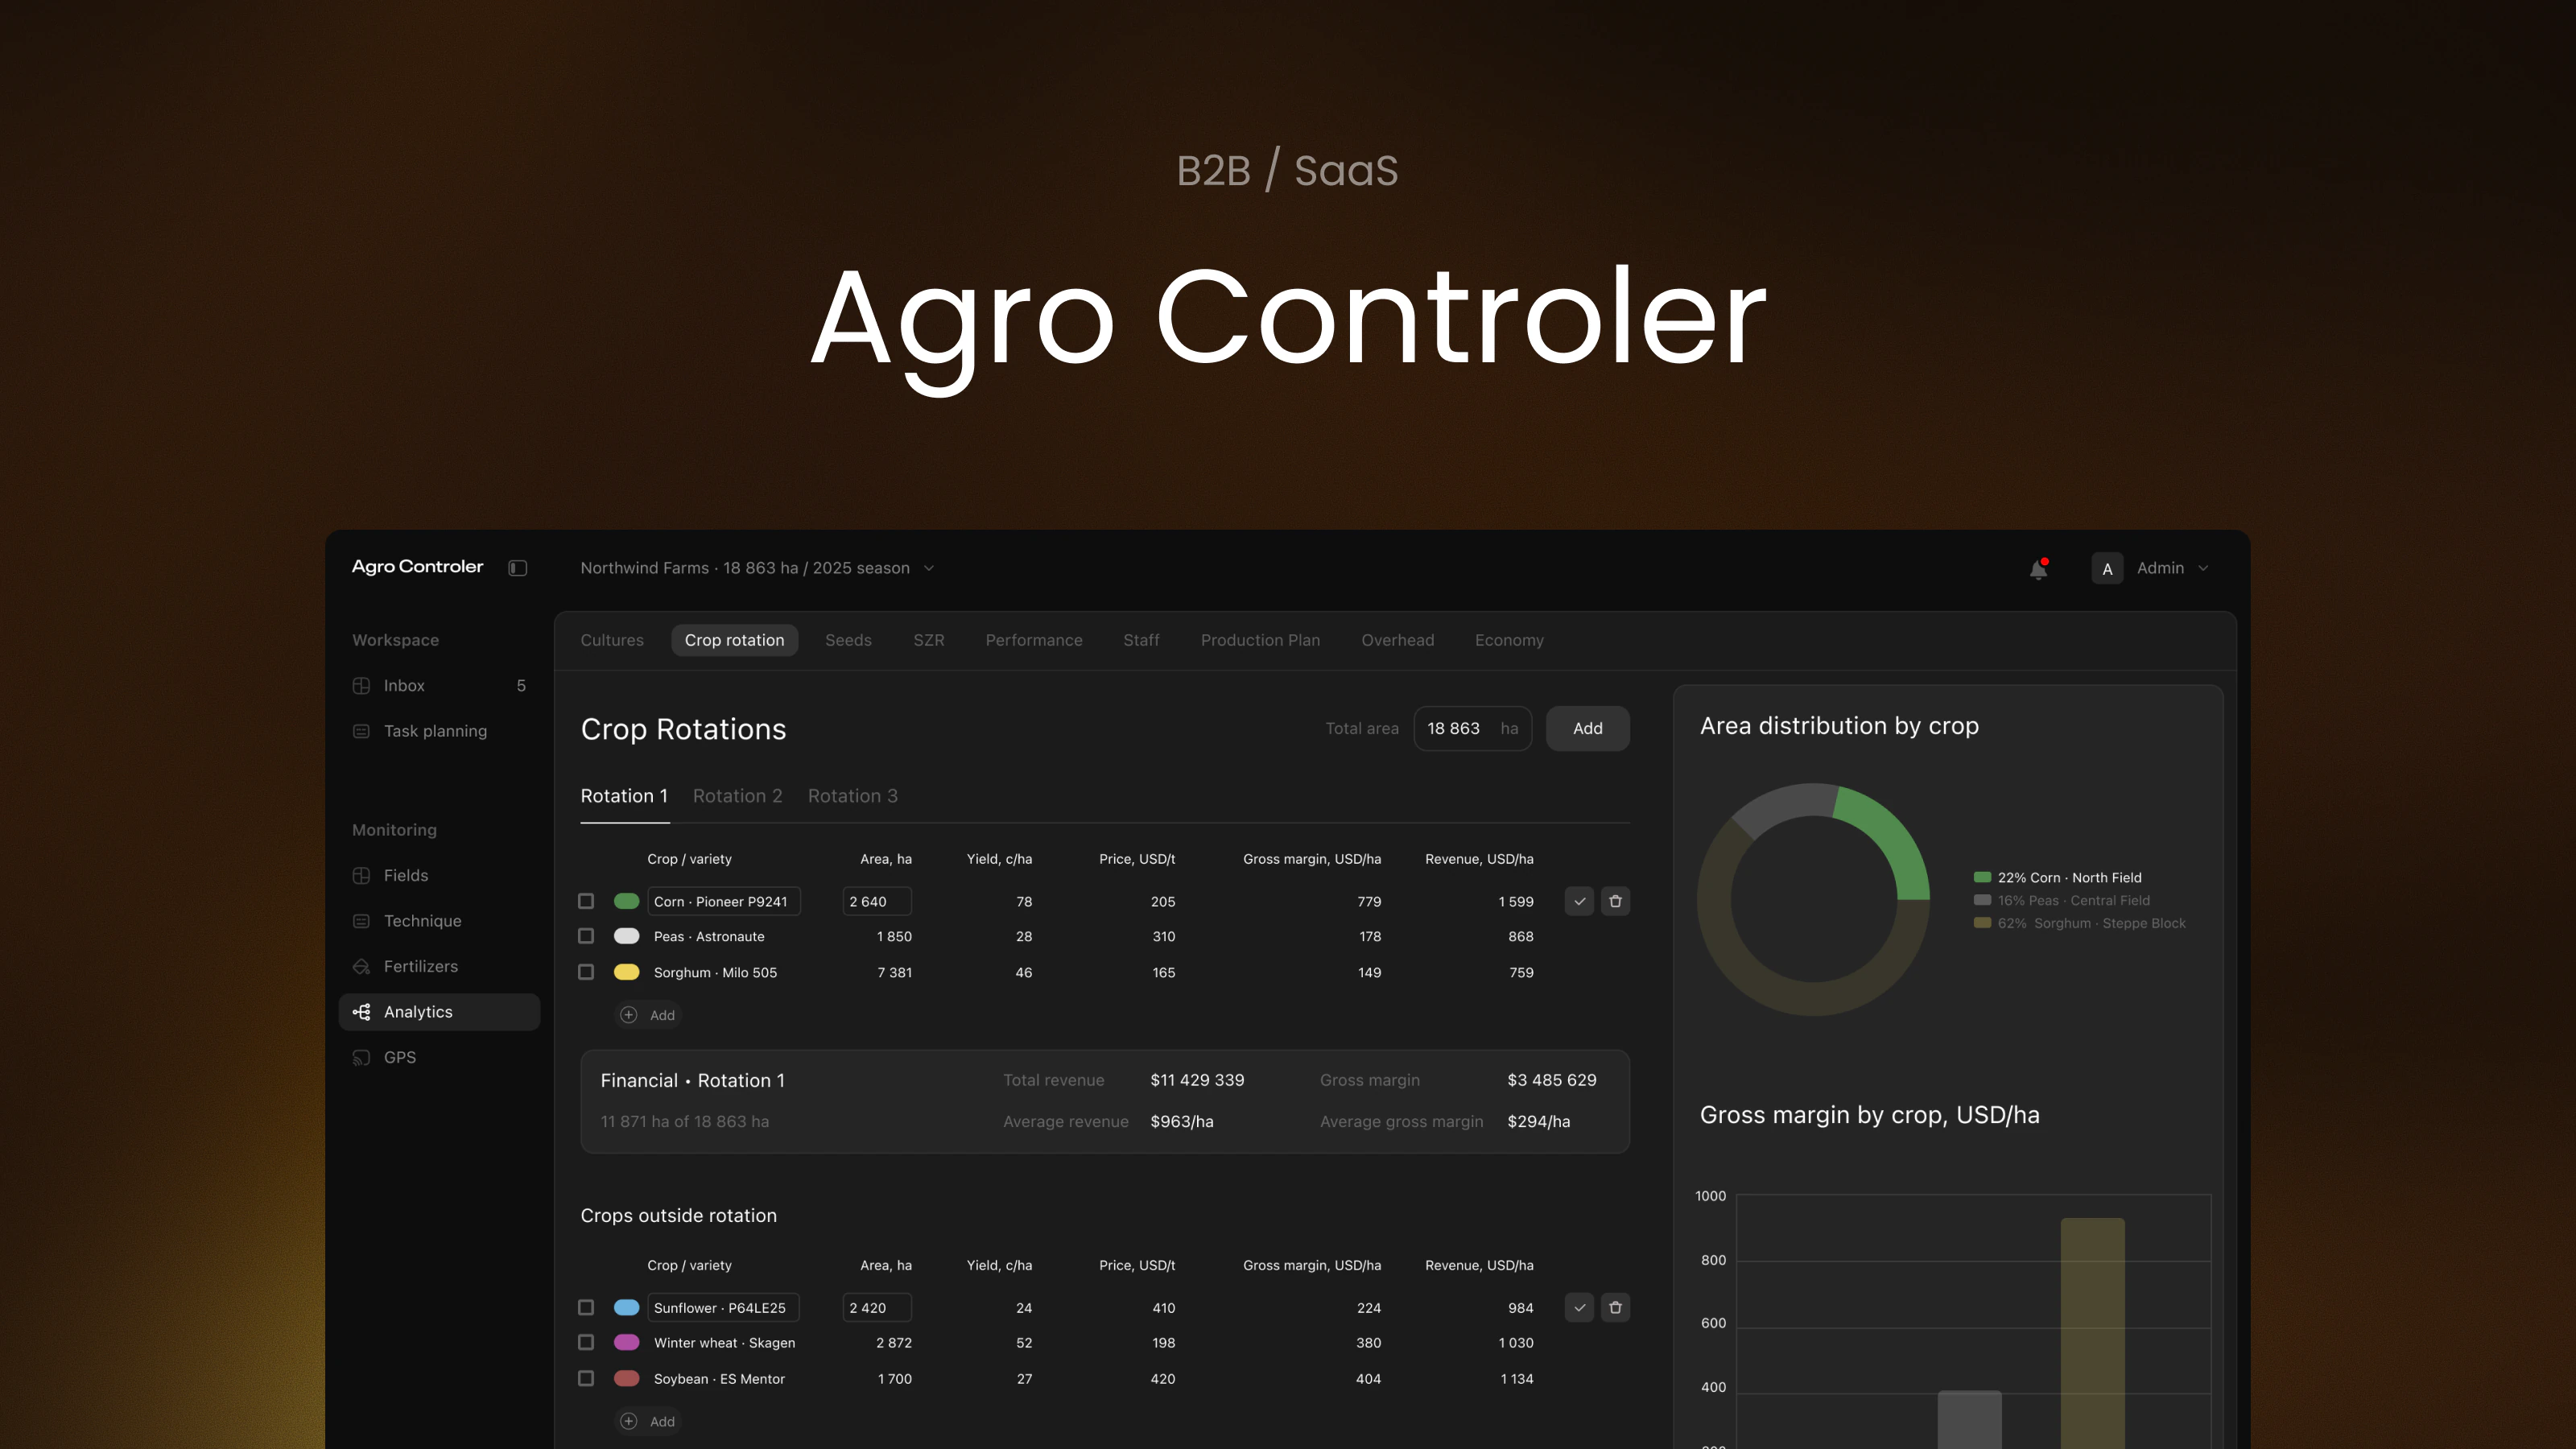
A crop rotation is not merely a list of crops. Users allocate land, set projected yield and price, and immediately see how each crop affects revenue and gross margin.

Editing happens directly in the table, while totals and charts stay in the same context. This lets a team compare scenarios without moving data between separate files or screens.

Crop rotation planning with economic indicators and chartsOpen full-size screen ↗

Decisions in context

Area, yield, price, and margin read as one model rather than disconnected indicators.

Direct editing

Key assumptions can be changed where the user evaluates their effect.

Scenario comparison

The table preserves precision, while summaries and charts make differences visible.

02 · Check the resources

Turn technical parameters into an operational answer

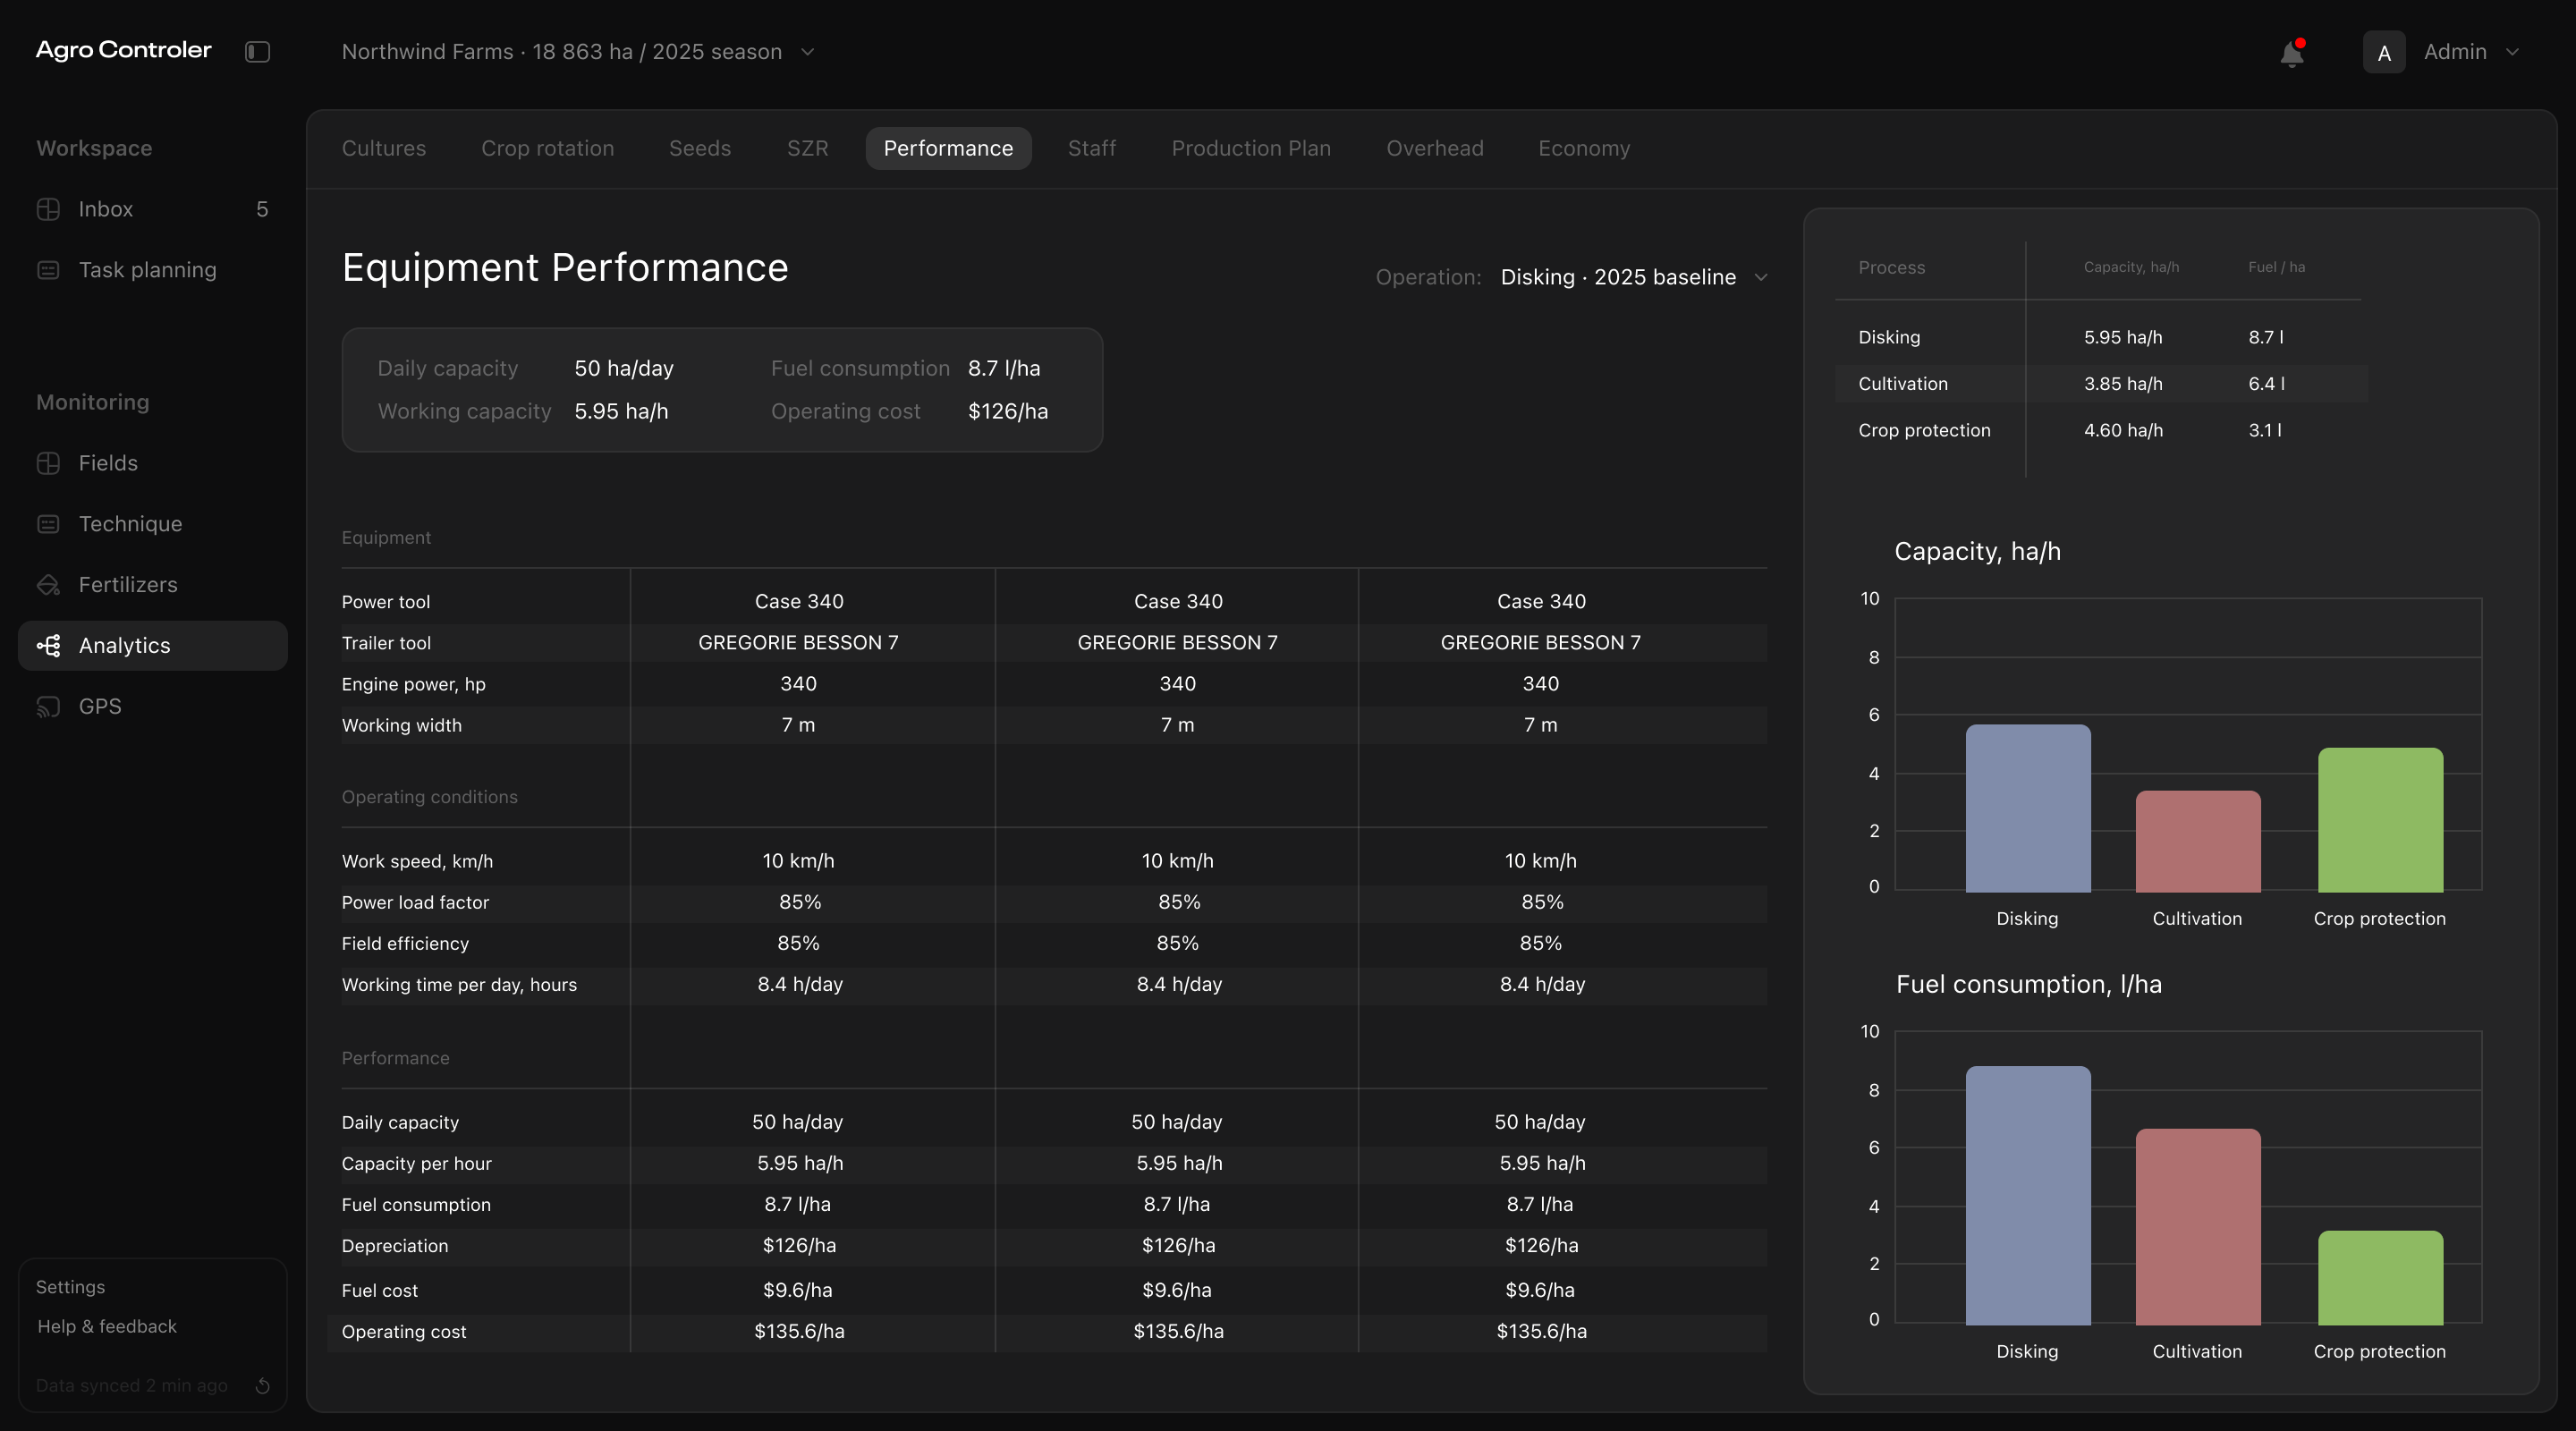
An operation's performance depends on equipment configuration, working width, speed, load factor, and available working time. A detailed table preserves the calculation, while summarized indicators make configurations comparable.

The interface does not hide the domain's complexity, but separates parameters, output, and cost. Users can understand not only which configuration is faster, but how many hectares it can cover, how much fuel it needs, and what the work costs.

Comparison of equipment performance, cost, and configuration parameters
Comparison of equipment performance, cost, and configuration parametersOpen full-size screen ↗
03 · Find the constraint

Show when a plan stops being realistic

The production plan connects crops, growth stages, operations, area, machine hours, and fuel consumption. The table alone, however, cannot answer the central question: can every operation be completed inside its required window?

Equipment capacity compares required and available machinery through the season. When demand exceeds the resource, the product reveals the shortage period, its scale, and the amount of work at risk. A complex calculation becomes a concrete decision point.

Equipment capacity shortage inside the production planOpen full-size screen ↗
04 · Move into execution

Close the loop between a plan and field work

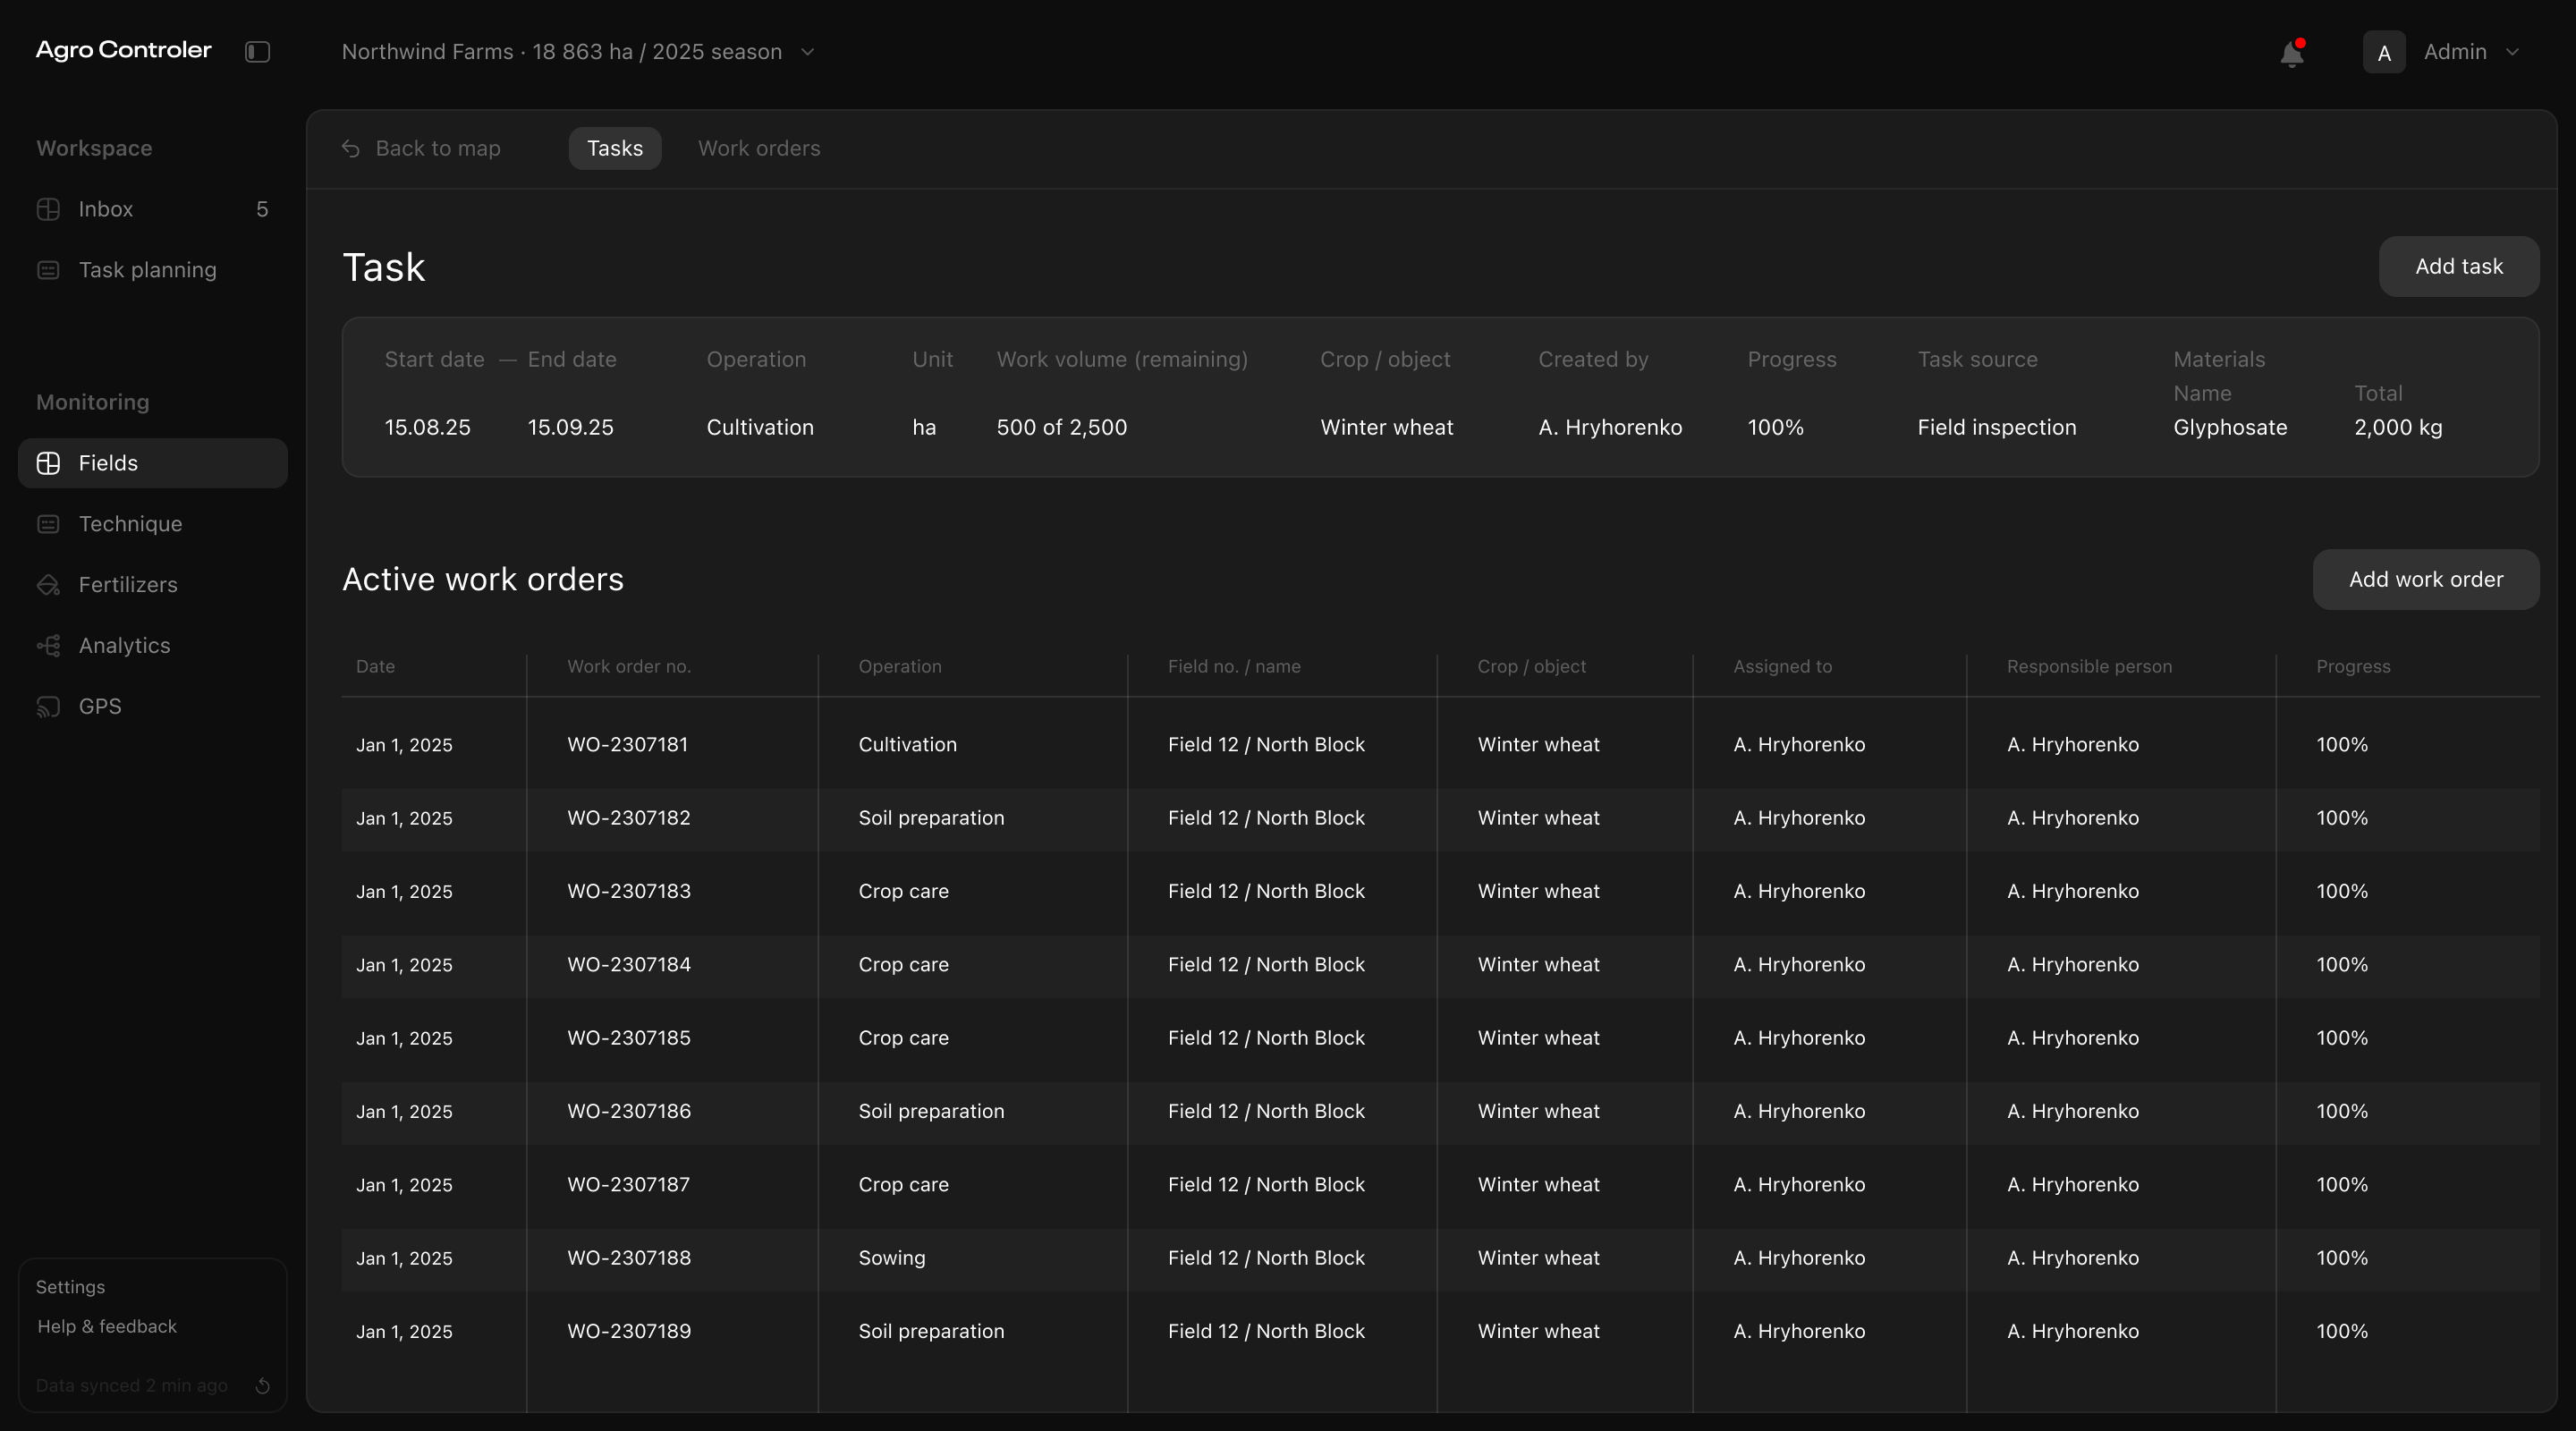
Planning ends not with a report, but with actual work. A task brings together dates, operation, crop, remaining volume, source, materials, and the responsible person.

Work orders break a planned operation into controlled assignments for a specific field and operator. The seasonal model becomes daily work while the team retains the connection between the reason for a decision and its execution.

Field tasks and active work orders
Field tasks and active work ordersOpen full-size screen ↗

Designing for dense operational work

A large amount of data is not a problem by itself. The problem begins when users cannot distinguish state, assumption, exception, and next action. The interface is organized around three principles.

01

Hierarchy before decoration

Table structure, grouping, and stable columns support scanning large datasets without losing context.

02

Exceptions before averages

Color and charts emphasize shortages, risks, and deviations instead of giving every value equal weight.

03

Action next to cause

Details and optimization open from the point where the user discovered a problem.

Design system

One visual language for planning, calculation and field work

Agro Controler connects planning, calculations and daily execution, so the design system has to work equally well for dense tables, analytical charts and short operational actions. Foundations set the shared visual language, semantic tokens separate an element’s role from its exact colour, and product patterns keep the same logic across modules.

The system is built in three layers: primitive values measured from the product, semantic roles used by every screen, and component tokens for decisions that belong to one component.

Neutral surfacesSix dark steps carry the whole interface hierarchy. Elevation is a lighter surface, never a shadow.
  • neutral.950#0d0d0eApp background
  • neutral.900#1b1b1cWorkspace panel
  • neutral.875#212122Row stripe, active nav
  • neutral.850#252526Card, summary
  • neutral.800#2a2a2bSide panel
  • neutral.750#323233Selected tab, button

Text & border alphas

  • white.100
  • white.70
  • white.50
  • white.30
  • white.10
  • white.05

Text and dividers are white at fixed opacities, so they stay consistent on every surface.

Semantic tokensScreens use roles, not hex values.

Background & surface

  • color.background.appneutral.950
  • color.surface.primaryneutral.900
  • color.surface.secondaryneutral.850
  • color.surface.elevatedneutral.800
  • color.surface.selectedneutral.750

Text

  • color.text.primarywhite.100
  • color.text.secondarywhite.70
  • color.text.mutedwhite.50
  • color.text.disabledwhite.30

Border

  • color.border.subtlewhite.05
  • color.border.defaultwhite.10
  • color.border.focusblue.400

Status

  • color.status.successgreen.300
  • color.status.warningsand.200
  • color.status.criticalred.300
  • color.status.infoslate.400
Data visualisationCategories and thresholds never share a colour logic: a crop colour cannot be read as a warning.

Crop categories

  • Corn#518a4d
  • Sorghum#edd25b
  • Rapeseed#d98a3d
  • Barley#7fb8a4
  • Chickpea#c7a878
  • Sunflower#6bb1dd
  • Wheat#ae4da3
  • Soybean#9e5050

Capacity threshold

  • Available capacity
  • Required capacity
  • Shortage

Process series

  • Disking
  • Cultivation
  • Crop protection

How product value should be measured

Screen views are not enough for this product. The useful question is whether the system helps a team create a realistic plan, detect constraints in time, and turn a decision into completed work.

The measurement model therefore follows the operating process. Specific values should only be added after analytics are implemented and verified against real product data.

  1. 01Plan created
  2. 02Risk detected
  3. 03Decision made
  4. 04Task created
  5. 05Work completed

What the case demonstrates

Agro Controler demonstrates work in a complex B2B domain at the level of a complete system: from data structure and calculations to workflows, visual hierarchy, and operational execution.

The core design outcome is not one screen. It is a continuous chain in which an economic assumption can be tested against a resource constraint, turned into a decision, and carried through to specific work in the field.